1. Introduction
Monitoring is a continuous process of collecting and analyzing information about an organization, a project or programme, that occurs during implementation to generate evidence needed to facilitate timely decision-making
. In the context of microfinance business, monitoring involves regular interaction with borrowers, to establish whether investments are executed as planned or not, accountability in the use of loan funds, assessment of risks and mentorship, among others
. Evaluation is the periodic, retrospective assessment of an organization, a project or a programme to determine the extent to which anticipated outcomes are achieved over a specific time, using monitoring or cross-sectional data
. Evaluation generates results for learning, improving performance and accountability to stakeholders, including beneficiaries, partners and donors, among others
. Thus, Monitoring and Evaluation (M&E) are interdependent processes that involve continuous tracking of organizational or project performance; as well as analysis and utilization of results to improve performance outcomes
| [26] | Okafor, A. E. (2021). Influence of monitoring and evaluation system on the performance of projects. Journal of Social Science and Humanities Research, 6(8), 34-49.
https://doi.org/10.53555/sshr.v6i8.4535 |
[26]
.
1.1. M&E Communication
Understanding and learning occur when M&E results are communicated to internal and external stakeholders in the most appropriate form and using effective channels to support decision-making, facilitate learning, and demonstrate performance
| [4] | Cassidy, C. & Ball, L. (2018). Communications monitoring, evaluating and learning toolkit. London: Overseas Development Institute. |
| [26] | Okafor, A. E. (2021). Influence of monitoring and evaluation system on the performance of projects. Journal of Social Science and Humanities Research, 6(8), 34-49.
https://doi.org/10.53555/sshr.v6i8.4535 |
[4, 26]
. M&E communication is considered effective when it’s able to influence decision-making and generate feedback. Effective communication is vital for the success of M&E systems, by facilitating data capture, identification of project strengths and weaknesses, communication of M&E results and enhancement of accountability
. Overall, communication of M&E results set the foundation for improving project performance outcomes
.
The M&E results may be communicated to internal stakeholders, viz. staff members in various departments through meetings, reports, memos or emails; as well as to external stakeholders such as beneficiaries, partners and donors through reports, policy briefs, workshops, social media, and community meetings, among others. M&E results may be communicated using charts, graphs or other visual aids, purposively to enable the audience understand the same
| [4] | Cassidy, C. & Ball, L. (2018). Communications monitoring, evaluating and learning toolkit. London: Overseas Development Institute. |
| [27] | Stetson, V. (2008). Communication and reporting on an evaluation. American Red Cross and Catholic Relief Services (CRS) M&E Module Series. Washington, DC: American Red Cross and Catholic Relief Services. |
[4, 27]
. M&E communication may also take the form of community engagements through focus group discussions, surveys and community meetings. The communication channels are diverse, the choice of which depends on specific needs of the targeted audience
| [26] | Okafor, A. E. (2021). Influence of monitoring and evaluation system on the performance of projects. Journal of Social Science and Humanities Research, 6(8), 34-49.
https://doi.org/10.53555/sshr.v6i8.4535 |
[26]
. Despite the above, M&E communication is vulnerable to generic challenges including language technicality, difficulty of choosing relevant information to communicate due to data overload, aligning M&E information with the needs of diverse stakeholders, time and budget constraints, resistance to change, as well as mistrust of M&E results by some stakeholders
.
In view of this, the success of M&E communication may be enhanced by practices, such as developing communication plans, diversifying communication channels to reach different stakeholders, tailoring communication to the needs and interests of stakeholders, packaging M&E results in plain language, using visualization tools to ease understanding, engaging stakeholders in the M&E process, providing timely feedback, as well as ensuring transparency and objectivity
| [10] | Hobson, K., Mayne, R., & Hamilton, J. (2014). A step-by-step guide to monitoring and evaluation. Retrieved on 11/10/2024 from http://www.geog.ox.ac.uk/research/technologies/projects/monitoringandevaluation.html |
| [24] | Nalianya, J. M. & Luketero, S. W. (2017). Monitoring and evaluation systems and performance of non-governmental based maternal health projects in Bungoma South Sub-County, Kenya. European Scientific Journal, 13 (23), 11-38.
https://doi.org/10.19044/esj.2017.v13n23p11 |
[10, 24]
. Such practices are likely to enhance the effectiveness of M&E communication in relation to organizational performance
.
1.2. Performance of Microfinance Institutions
Microfinance Institutions (MFIs) are vital for boosting and sustaining small and medium SMEs by providing affordable credit facilities, creating employment opportunities, improving income for entrepreneurs, and contributing to economic development
| [1] | Abuto, R. O. (2019). Effect of credit management practices on loan repayment performance in micro finance institutions in Kisumu Town, Kenya. Master’s Thesis, Maseno University Kenya. Retrieved on 26/03/24 from
https://repository.maseno.ac.ke/bitstream/handle/123456789/1144/...pdf? |
| [18] | King’ori, S. N., Kioko, W. C. & Shikumo, H. D. (2017). Determinants of financial performance of microfinance banks in Kenya. Research Journal of Finance and Accounting, 8 (16), 1-8. |
[1, 18]
. MFIs provide opportunities for SME projects, often considered uncreditworthy by commercial banks, to access micro-credit services, improve capitation, enhance productivity and contribute to sector Gross Domestic Product
| [25] | Njue, A. M., Kariuki, S. N. & Njeru, D. M. (2020). Liquidity management and financial performance of microfinance institutions in Kenya. The Journal of Social Sciences Research, 6 (1), 943-953. https://doi.org/10.32861/jssr.611.943.953 |
[25]
.
Microfinance has evolved over the past five decades as a strategic financial mechanism for developing SMEs, alleviating poverty, promoting entrepreneurial development, and creating employment opportunities, especially in emerging market economies where SMEs have limited or no access to capital markets
. Gosa
| [8] | Gosa, S. T. (2014). The role of microfinance institutions in poverty reduction and women’s Empowerment in Ethiopia: The case of Dedibit Credit and Saving Institution. Public Policy and Administration Research, 4 (8), 83-92. |
[8]
describes MFIs as the primary hope for poor entrepreneurs in rural and urban settings, with limited access to credit facilities offered by mainstream banks, particularly due to lack of appropriate collateral, low capitation and poor repayment capacity. Thus, MFIs are credited for creating banking services that are affordable and accessible to the poor
. Despite this, the environment in which MFIs operate is characterized by stiff competition from commercial banks, with far-reaching consequences in their performance and development of MFIs
| [18] | King’ori, S. N., Kioko, W. C. & Shikumo, H. D. (2017). Determinants of financial performance of microfinance banks in Kenya. Research Journal of Finance and Accounting, 8 (16), 1-8. |
[18]
.
In Kenya, the microfinance sector is described by authors such as Kingori et al.
| [18] | King’ori, S. N., Kioko, W. C. & Shikumo, H. D. (2017). Determinants of financial performance of microfinance banks in Kenya. Research Journal of Finance and Accounting, 8 (16), 1-8. |
[18]
, as one of the most vibrant in the Sub-Saharan Africa (SSA); with a diversity of institutions of various sizes, in terms of capital, asset and human resource base; as well as branch network
| [31] | Financial Sector Deepening (FSD) Kenya. (2017). FinAccess Household Survey 2017: Profiling developments in financial inclusion in Kenya. Nairobi: FSD Kenya. |
[31]
. The Microfinance sector is founded on the Microfinance Act No. 19 of 2006, which was amended and re-enacted as Microfinance Act of 2019
| [5] | Central Bank of Kenya (2019). Bank Supervision Annual Report 2019. Nairobi: CBK. |
[5]
. The Act provides the legislative framework that regulates the establishment, business and operations of MFIs in Kenya
| [25] | Njue, A. M., Kariuki, S. N. & Njeru, D. M. (2020). Liquidity management and financial performance of microfinance institutions in Kenya. The Journal of Social Sciences Research, 6 (1), 943-953. https://doi.org/10.32861/jssr.611.943.953 |
[25]
. The first MFI was licensed by CBK in 2009. Since then, hundreds more have been facilitated into the market, to enable SMEs access affordable financial services in the spirit of financial inclusion
| [15] | Issack, A. I. & Mutswenje, V. S. (2022). Financial risks and financial performance of micro financial institutions in Kenya. International Academic Journal of Economics and Finance, 3 (8), 186-202. |
[15]
. Despite this, a recent Bank Supervision Annual Report of 2021 identified poor performance, in terms of high default and insolvency rates, as a key feature of the microfinance sector in Kenya. The Report elaborates that the biggest risk in microfinance sector is lending money and not getting it back promptly; thereby, leading to liquidity management problems. Deteriorating liquidity management is the most frequent cause of poor financial performance
| [25] | Njue, A. M., Kariuki, S. N. & Njeru, D. M. (2020). Liquidity management and financial performance of microfinance institutions in Kenya. The Journal of Social Sciences Research, 6 (1), 943-953. https://doi.org/10.32861/jssr.611.943.953 |
| [32] | Central Bank of Kenya (CBK). (2021). Bank supervision annual report 2021. Nairobi: Central Bank of Kenya. |
[25, 32]
.
The CBK Report further links poor performance of MFIs to macro-economic dynamics such as foreign exchange fluctuations, changes in sector regulatory policies and competition from commercial banks; as well as management issues, including limited follow-up, interaction and mentorship of borrowers
| [15] | Issack, A. I. & Mutswenje, V. S. (2022). Financial risks and financial performance of micro financial institutions in Kenya. International Academic Journal of Economics and Finance, 3 (8), 186-202. |
| [32] | Central Bank of Kenya (CBK). (2021). Bank supervision annual report 2021. Nairobi: Central Bank of Kenya. |
[15, 32]
. In some instances, liquidity issues among MFIs have led to wrong investment decisions and weakened the capacity to monitor and evaluate borrowers’ performance and related underlying factors, with far-reaching effects on financial performance
| [25] | Njue, A. M., Kariuki, S. N. & Njeru, D. M. (2020). Liquidity management and financial performance of microfinance institutions in Kenya. The Journal of Social Sciences Research, 6 (1), 943-953. https://doi.org/10.32861/jssr.611.943.953 |
[25]
. In relation to this, Abuto
underscored late repayment of loans as the primary factor constraining performance of MFIs financing SMEs in Kenya and other emerging market economies; thereby, compounding the challenge of non-performing loans, eroding the profitability of MFIs, and impairing the objective of financial inclusion of poor entrepreneurs into financial market system.
Performance of MFIs may be looked at from three perspectives, namely, financial, non-financial and social. Whereas, financial performance focuses on metrics such as profit after tax, return on investments, return on assets, return on equity, shareholders’ value, sales revenue and market share, among others
| [33] | Herdinata, C. (2017). Determinants of financial performance in microfinance institutions. Journal of Business and Management Studies, 3(4), 112–120. |
| [34] | Rawat, D. S., & Govind, R. (2017). Financial performance analysis of microfinance institutions: Evidence from developing economies. International Journal of Finance and Accounting Research, 6(2), 55–68. |
[33, 34]
; non-financial performance revolves around customer and employee satisfaction, efficiency, effectiveness and relevance; while social performance focuses on poverty alleviation
| [15] | Issack, A. I. & Mutswenje, V. S. (2022). Financial risks and financial performance of micro financial institutions in Kenya. International Academic Journal of Economics and Finance, 3 (8), 186-202. |
| [18] | King’ori, S. N., Kioko, W. C. & Shikumo, H. D. (2017). Determinants of financial performance of microfinance banks in Kenya. Research Journal of Finance and Accounting, 8 (16), 1-8. |
[15, 18]
. Overall, an organization’s financial performance signals the extent of efficiency and competitiveness, and the potential to contribute to development
| [30] | Yenesew, A. (2014). Determinants of financial performance: A study on selected micro finance institutions in Ethiopia. Unpublished Project. JIMMA University, Ethiopia. |
[30]
. Whereas, poor financial performance undermines the potential of MFIs to absorb negative shocks and minimize insolvency risks, optimal financial performance enables lenders to recover full cost, make profit and build self-sustaining institutions, with minimal or no reliance on government subsidies or donor funding
| [30] | Yenesew, A. (2014). Determinants of financial performance: A study on selected micro finance institutions in Ethiopia. Unpublished Project. JIMMA University, Ethiopia. |
[30]
. In the context of MFIs, financial performance depends on the extent to which borrowers are able to repay credit facilities advanced to them in time.
Performance of MFIs is a subject that has charmed empirical studies across the globe. Thus, previous studies conducted in various contexts have looked at financial performance of MFIs in relation to various underlying factors, including operational efficiency, capital adequacy and firm size
| [18] | King’ori, S. N., Kioko, W. C. & Shikumo, H. D. (2017). Determinants of financial performance of microfinance banks in Kenya. Research Journal of Finance and Accounting, 8 (16), 1-8. |
[18]
; as well as management of financial risks
| [15] | Issack, A. I. & Mutswenje, V. S. (2022). Financial risks and financial performance of micro financial institutions in Kenya. International Academic Journal of Economics and Finance, 3 (8), 186-202. |
[15]
, among others. Besides, a few studies have examined the relationship between M&E and performance of organizations as well as projects. For example, Chantel
| [35] | Chantel, E. M. (2008). The influence of monitoring and evaluation systems on organizational performance [Master’s thesis, University of Nairobi]. University of Nairobi Repository. |
[35]
indicated that organizational performance can be influenced by the effectiveness of M&E systems; Okafor
| [26] | Okafor, A. E. (2021). Influence of monitoring and evaluation system on the performance of projects. Journal of Social Science and Humanities Research, 6(8), 34-49.
https://doi.org/10.53555/sshr.v6i8.4535 |
[26]
investigated the influence of M&E system on the performance of projects in Nigeria; while Karanja and Muchelule
| [16] | Karanja, J. W. & Muchelule, Y. (2018). Role of monitoring and evaluation on performance of non-governmental organizations projects in Kiambu County. International Journal of Management and Commerce Innovations, 6 (1), 649-664. |
[16]
assessed the role of M&E on performance of Non-Government Organization projects in Kenya. Notably though, few or no previous studies delved into the nexus between M&E communication and performance of MFI projects, leading to shortage of information that can be used to improve financial inclusion of SMEs and economic development
| [29] | Workneh, E. Y. & Aga, D. A. (2022). The effect of monitoring and evaluation practices on the success of development projects of non-governmental organizations. African Journal of Leadership and Development, 7 (2), 17-32.
https://doi.org/10.63990/2022ajoldvol7iss2pp17?32 |
[29]
. This study set to establish how M&E communication influences performance of MFIs financing SMEs in Kenya.
1.3. Organizational Culture
Organizational culture refers to a pattern of shared practices, norms, values, assumptions, and beliefs created by organizational leaders, managers and members to guide employees’ conduct, interaction and work performance
. Organizational culture also entails unique work methods, including teamwork, values such as accountability and learning; leadership efficiency and involvement of various stakeholders, including clients, financiers, partners and regulators, among others
| [2] | Barends, E. & Rousseau, D. (2022). Organizational culture and performance: an evidence review. Scientific summary. London: Chartered Institute of Personnel and Development. |
[2]
. Organizational culture can be positive or negative, strong or weak. Whereas a positive organizational culture promotes employees’ well-being, growth, development, motivation and performance, a negative culture propagates toxic work environments, with potential to impede employees’ motivation and performance
. On the same note, Mafrudoh
associated organizational culture with workers’ motivation, happiness, satisfaction and high productivity. Thus, workers committed to organization culture are likely to commit to the achievement of organizational goals. Although a few studies have explored the potential connection between organizational culture and performance, no previous study had examined the moderating influence of organizational culture on the relationship between M&E communication and performance, particularly in the MFIs sector.
2. Literature Review
This section presents and synthesizes the theoretical framework that guided the study, alongside a review of the relevant empirical literature.
2.1. Theoretical Framework
This study drew from the Systems Theory, Organizational Learning Theory (OLT), and the Resource-Based View (RBV) to explain how M&E communication influences the performance of MFIs in Kenya, and how organizational culture moderates the relationship. Systems Theory views MFIs as open systems that depend on feedback loops to respond to environmental and internal changes
. In this regard, M&E communication functions as a critical feedback mechanism, for collecting, processing, and disseminating information to guide adaptive decision-making, enhance efficiency, and inform strategic alignment. Through the OLT, the study explains how communicated M&E findings stimulate organizational learning by promoting reflection, dialogue, and corrective action. The extent of this learning; however, depends on the organizational culture. A participatory, learning-oriented culture encourages the effective use of M&E information, while a rigid, hierarchical culture restricts it
| [37] | Dixon, N. M. (1999). The organizational learning cycle: How we can learn collectively. Gower Publishing. |
| [38] | Naveed, R. T., Alhaidan, H., & Abbas, J. (2022). Do organizations really learn from experience? The moderating role of organizational culture in the relationship between learning and performance. Journal of Open Innovation: Technology, Market, and Complexity, 8(1), 18.
https://doi.org/10.3390/joitmc8010018 |
[37, 38]
. Thus, culture acts both as an enabler and constraint in transforming feedback into improved performance.
The RBV complements these perspectives by conceptualizing organizational culture as a strategic intangible resource that determines how effectively M&E communication enhances performance
. Thus, institutions with strong, adaptive cultures can better interpret and act upon M&E insights, gaining sustainable advantages. Collectively, these theories highlight that MFI performance is not solely dependent on the existence of M&E communication systems, but on their alignment with an enabling organizational culture. Therefore, integrated theoretical framework provides a holistic explanation of how and why MFIs differ in leveraging M&E communication for optimal performance outcomes. While the theoretical framework shows how M&E communication and organizational culture interact to influence institutional performance, empirical studies conducted provide concrete evidence on how these relationships manifest in real organizational contexts, particularly within microfinance and development sectors.
2.2. Empirical Literature
Workneh and Aga
| [29] | Workneh, E. Y. & Aga, D. A. (2022). The effect of monitoring and evaluation practices on the success of development projects of non-governmental organizations. African Journal of Leadership and Development, 7 (2), 17-32.
https://doi.org/10.63990/2022ajoldvol7iss2pp17?32 |
[29]
investigated the influence of M&E practices on the success of development projects in the Non-Governmental Organization (NGO) sector in Ethiopia. Using the survey research design and a sample of 92 development projects implemented by NGOs, the study reported that M&E practices, including planning, technical skill, budgeting and stakeholders’ engagement, had positive and significant effects on project performance. Stakeholder engagement was vital for improving learning, decision-making and feedback. The higher the frequency of stakeholder engagement, the more the success reported by projects. Even though stakeholder engagement is an aspect of communication, the study focused on performance of NGO projects, rather than MFIs financing SMEs.
Okafor
| [26] | Okafor, A. E. (2021). Influence of monitoring and evaluation system on the performance of projects. Journal of Social Science and Humanities Research, 6(8), 34-49.
https://doi.org/10.53555/sshr.v6i8.4535 |
[26]
investigated the influence of M&E system on the performance of projects in Nigeria, and established a significant positive correlation between M&E and project performance (r = 0.6; ρ<0.05). More particularly, the study revealed significant positive correlations between project performance and three M&E aspects, including plan (r = 0.8; ρ<0.05), skills (r = 0.7; ρ<0.05) and information management system (r = 0.5; ρ<0.05). All the correlations were significant at 99% confidence level. In connection to this study, Okafor
| [26] | Okafor, A. E. (2021). Influence of monitoring and evaluation system on the performance of projects. Journal of Social Science and Humanities Research, 6(8), 34-49.
https://doi.org/10.53555/sshr.v6i8.4535 |
[26]
showed the significance of M&E information management systems in relation to project performance. Information management system involves people, technology, data capture, storage, retrieval, analysis, reporting and communication of results. Thus, Okafor’s study had no specific focus on the concept of communication of M&E results to stakeholders. Besides, the study targeted projects in the NGOs sector, which may be different from MFIs in terms of performance outcomes, M&E communication systems, and organizational culture, among other parameters.
In their study, Issack and Mutswenje
| [15] | Issack, A. I. & Mutswenje, V. S. (2022). Financial risks and financial performance of micro financial institutions in Kenya. International Academic Journal of Economics and Finance, 3 (8), 186-202. |
[15]
showed that financial performance of MFIs financing SMEs was significantly affected by credit risks (ρ<0.05) and liquidity risks (ρ<0.05). However, the influence of each variable was moderated by regular mentorship of SMEs during risk assessment, mentorship and feedback visits. Notably, regular interaction with SMEs provided ideas on expenditure and investment management, which enabled prudent use of borrowed funds. Results showed that the more the interaction between MFIs and borrowers, the lower the financial risks and the higher the loan repayment. The study advocated for strengthening of interaction between MFIs and borrowers by establishing communication strategies to enable SMEs cope with macro-economic dynamics such as competition from commercial banks, government financial sector policies, and political stability, among others, with immense influence on sector-specific financial risks. The study showed that interaction between MFIs and borrowers during risk assessment, mentorship and feedback visits was crucial for moderating the relationship between financial risks and performance. However, the study was not explicit about the role of M&E communication on performance of MFIs financing SMEs.
Karanja and Muchelule
| [16] | Karanja, J. W. & Muchelule, Y. (2018). Role of monitoring and evaluation on performance of non-governmental organizations projects in Kiambu County. International Journal of Management and Commerce Innovations, 6 (1), 649-664. |
[16]
focused on M&E pillars such as planning, stakeholder participation, ICT integration and technical expertise. Using a descriptive survey research design, data were obtained from 51 registered NGOs in Kiambu County, Kenya. The study reported project staffs’ unclarity with M&E function, with some handing roles that were inconsistent with their qualifications and experience. Other challenges included limited involvement of stakeholders in budgeting plans and resource allocation, with far-reaching effects on performance of the projects. Despite this, the study wasn’t explicit about M&E communication to stakeholders and its effect on project performance. Kingori et al.
| [18] | King’ori, S. N., Kioko, W. C. & Shikumo, H. D. (2017). Determinants of financial performance of microfinance banks in Kenya. Research Journal of Finance and Accounting, 8 (16), 1-8. |
[18]
reported a positive and statistically significant connection between independent variables such as operational efficiency, capital adequacy and firm size; and financial performance of microfinance banks in Kenya. The study reported that the relationship was negative and insignificant for variables such as liquidity risk, credit risk and financial performance of MFIs financing SMEs in Kenya. Although the study dwelt on performance of MFIs financing SMEs, matters of M&E communication were off its scope.
A synthesis of previous studies reviewed above reveals a consistent pattern, suggesting that effective M&E systems combined with active stakeholder interaction can potentially improve organizational and project outcomes. However, the specific contribution of M&E communication remains underexplored, particularly among MFIs serving SMEs. Specifically, Workneh and Aga
| [29] | Workneh, E. Y. & Aga, D. A. (2022). The effect of monitoring and evaluation practices on the success of development projects of non-governmental organizations. African Journal of Leadership and Development, 7 (2), 17-32.
https://doi.org/10.63990/2022ajoldvol7iss2pp17?32 |
[29]
, as well as Okafor
| [26] | Okafor, A. E. (2021). Influence of monitoring and evaluation system on the performance of projects. Journal of Social Science and Humanities Research, 6(8), 34-49.
https://doi.org/10.53555/sshr.v6i8.4535 |
[26]
demonstrate a strong positive link between M&E practices such as planning, technical capacity, budgeting, and stakeholder engagement, and project success. Okafor further emphasizes the importance of robust M&E information systems, while Workneh and Aga highlight that frequent engagement strengthens learning, decision-making, and feedback loops.
In the MFI context, Issack and Mutswenje
| [15] | Issack, A. I. & Mutswenje, V. S. (2022). Financial risks and financial performance of micro financial institutions in Kenya. International Academic Journal of Economics and Finance, 3 (8), 186-202. |
[15]
show that regular interaction through mentorship and feedback visits moderate credit and liquidity risks; thereby, improving repayment rates. Conversely, Karanja and Muchelule
| [16] | Karanja, J. W. & Muchelule, Y. (2018). Role of monitoring and evaluation on performance of non-governmental organizations projects in Kiambu County. International Journal of Management and Commerce Innovations, 6 (1), 649-664. |
[16]
point out that unclear M&E roles and weak stakeholder participation hinder project success, thus, reinforcing the notion that ‘communication deficits can impair performance’. Although Kingori et al.
| [18] | King’ori, S. N., Kioko, W. C. & Shikumo, H. D. (2017). Determinants of financial performance of microfinance banks in Kenya. Research Journal of Finance and Accounting, 8 (16), 1-8. |
[18]
identify financial performance drivers such as efficiency and capital adequacy, they overlook the role of M&E communication, leading to a research gap.
Collectively, the literature indicates that competent M&E functions and effective communication can enhance learning, corrective action, and stakeholder buy-in, which are critical for organizational performance. Despite this, empirical tests directly linking M&E communication to MFI financial performance remain scarce. Addressing this gap could deepen the theoretical understanding, and provide practical insights for MFIs seeking to mitigate risk and enhance portfolio performance.
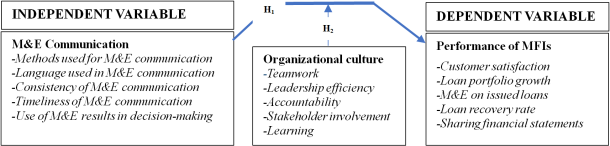
Figure 1 shows the conceptual framework hypothesizing relationships between M&E communication and performance of MFIs financing SMEs in Kenya.
Figure 1. Conceptual framework.
The conceptual framework layout suggests that M&E communication is likely to influence performance of MFIs financing SMEs in Kenya. Based on this, two null hypotheses were formulated and tested using empirical data. H01: M&E communication has no significant influence on performance of MFIs in Kenya. H02: Organizational culture has no significant influence on the relationship between M&E communication and performance of MFIs in Kenya.
3. Methodology
The study was guided by pragmatism paradigm, holding that knowledge is not only generated through objective measurement of reality (quantitative approach), but also through subjective meanings from the experiences of research subjects about the study phenomenon (qualitative approach). Thus, pragmatism provides the basis for the application of mixed methods approach
| [3] | Brierley, J. A. (2017). The role of a pragmatist paradigm when adopting mixed methods in behavioral accounting research. International Journal of Behavioral Accounting and Finance, 6 (2), 140-154. https://doi.org/10.1504/IJBAF.2017.086432 |
| [17] | Kaushik, V. & Walsh, C. A. (2019). Pragmatism as a research paradigm and its implications for social work research. Social Sciences, 8 (9), 255. https://doi.org/10.3390/socsci8090255 |
[3, 17]
.
The study adopted the cross-sectional survey design, with mixed methods. Both descriptive and analytical components of the design were used to understand characteristics of a population under study and to analyze relationship between the variables. The quantitative methods were used to generated data for testing the relationship between M&E communication and performance of MFIs financing SMEs, while qualitative methods sourced data for in-depth understanding of the relationship between the two concepts. The design is cost-effective and efficient in terms of time because it relies on one episode of data collection
. The study population consisted of 10 MFIs licensed by the CBK to operate in Kisumu County, with a total of 36 branches, as distributed in
Table 1.
Table 1. Distribution of target population by branch.
Name of MFI | Branches | Managers (a) | Depart’l heads (b) | Entrepreneurs (c) | Population [a+b+c] |
KWFT | 5 | 5 | 20 | 720 | 745 |
FAULU | 5 | 5 | 20 | 480 | 505 |
RAFIKI | 2 | 2 | 8 | 260 | 270 |
SMEP | 5 | 5 | 20 | 240 | 265 |
PLATINUM | 4 | 4 | 16 | 310 | 330 |
ECOLOF | 2 | 2 | 8 | 180 | 190 |
CENTURY | 2 | 2 | 8 | 210 | 220 |
KCB | 7 | 7 | 28 | 650 | 685 |
ADOK TIMO | 2 | 2 | 8 | 320 | 330 |
WEDCO | 2 | 2 | 8 | 550 | 560 |
Total | 36 | 36 | 144 | 3,920 | 4,100 |
Table 1 shows that the MFIs were run by 36 managers and 144 departmental heads, and had provided loans to 3,920 SMEs in the preceding financial year of 2019/2020. The study targeted the three categories of stakeholders, including managers, departmental heads dealing with monitoring and evaluation, and the entrepreneurs that had benefitted from funding for SMEs during the reference period. Collectively, the study targeted a population of 4,100 respondents, including 36 managers, 144 departmental heads and 3,920 entrepreneurs.
Sample size for quantitative data was computed using Taro Yamane’s formula
. The formula states that:
. Where:
n is the required sample size,
N is the population (4,100),
e is the degree of accuracy expressed as a proportion (0.05), which is equivalent to 5% error margin. This sets the confidence interval at 95%; and 1 is the constant term of the equation. The process obtained a sample size of 364 respondents.
Table 2 shows the distribution of sample size for entrepreneurs.
Table 2. Proportionate distribution of sample size for entrepreneurs.
MFI | Population | Sample |
KWFT | 745 | 66 |
FAULU | 505 | 45 |
RAFIKI | 270 | 24 |
SMEP | 265 | 24 |
PLATINUM | 330 | 29 |
ECOLOF | 190 | 17 |
CENTURY | 220 | 20 |
KCB | 685 | 61 |
ADOK TIMO | 330 | 29 |
WEDCO | 560 | 50 |
Total | 4,100 | 364 |
The study also sampled a subset of size 10 managers and 10 departmental heads for Key Informant Interviews (KIIs). The sample sizes were based on the principle of data saturation, which is the point at which three more sessions or interviews reveal no new themes. For KIIs, saturation points range between 2 and 10 sessions, depending on the comprehensiveness of interview tools and facilitation skills. The stated sample sizes were anticipated to achieve a saturation of up to 90%
| [9] | Guest, G., Namey, E., & McKenna, K. (2016). How many focus groups are enough? Building an evidence base for nonprobability sample sizes. Field Methods, 29(1), 3-22.
https://doi.org/10.1177/1525822X16639015 |
[9]
.
Stratified random sampling technique was used to sample respondents, and stratification was based on gender. For qualitative data, a subset of managers and departmental heads was sampled purposively based on direct or indirect involvement in M&E processes, communication, customer care, and organizational performance. Primary data were collected using three sets of tools, including structured questionnaires for entrepreneurs and Departmental heads; and a key informant interview guide for MFI managers. Whereas, the structured questionnaires were used to source quantitative and quantifiable data, while the interview guide captured qualitative data. The tools were pre-tested in the neighboring Vihiga County with 2 managers, 5 Departmental heads and 36 entrepreneurs. The tools were refined to address content, wording, layout, length and instructional issues revealed by the pre-test. Validity of the tools was determined using Content Validity Index (CVI), while reliability was determined using Cronbach’ alpha. The processes obtained a CVI of 0.8, which is above the 0.7% threshold
| [6] | Cohen, R., & Swerdlik, M. (2009). Psychological testing and assessment: An introduction to tests and measurement (7th ed.). New York: McGraw Hill. |
[6]
; and an alpha of 0.8, which was also above the minimum threshold
| [19] | Leary, M. R., Kelly, K. M., Cottrell, C. A., & Schreindorfer, L. S. (2013). Construct validity of the need to belong scale: Mapping the nomological network. Journal of Personality Assessment, 95(6), 610–624.
https://doi.org/10.1080/00223891.2013.819511 |
[19]
.
Primary data were collected in May 2020. The investigator acquired necessary authorization and a research permit from National Commission for Science, Technology and Innovation (NACOSTI), University of Nairobi and County Commissioner of Kisumu. Quantitative and qualitative analysis techniques were deployed to process and analyze the data. Quantitative analysis techniques included frequency distributions with percentages, cross-tabulations; correlation analysis and multiple linear regression analysis. The analysis focused on determining correlations between M&E communication and performance, as well as influence of M&E communication on performance of MFIs financing SMEs.
The regression model stated that: Yj = β0 + β1X1 + [β1X1* βm1Xm1] + ε; where: Yj is the dependent variable (performance of MFIs financing SMEs); β0 is the regression constant; β1 is the partial regression coefficient associated with the independent variable (M&E communication); X1 is the independent variable; βm1 is the partial regression coefficient associated with the moderating variable (organizational culture); Xm1 is the moderating variable; while ε is the error term. Performance of MFIs was measured by asking respondents to indicate views on selected performance indicators, on a five-point Likert scale calibrated as strongly agree = 5, agree = 4, neutral = 3, disagree = 2, and strongly disagree = 1. The regression model was fitted on the assumptions of normality, linearity and absence of multi-collinearity issues. Qualitative data were analyzed using thematic analysis.
Respondents were given opportunity to decide on whether to participate in the study or not. They were assured of confidentiality of their information, and the decision to withdraw consent any anytime during the data collection process. The data were stored under lock and key and with strong passwords to prevent unauthorized access.
4. Results
This section is organized into four subsections: respondents’ demographic characteristics, the performance of MFIs financing SMEs, correlation analysis, and regression analysis.
4.1. Demographic Characteristics of the Respondents
Data were sourced from 354 respondents, including 36 (10.2%) managers of MFIs, 144 (40.7%) departmental heads, and 174 (49.2%) entrepreneurs. The study captured information on respondents’ gender, age and educational status.
Table 3 shows that the 354 respondents consisted of 211 (59.6%) males and 143 (40.4%) females. The proportion of men was higher among the managers, departmental heads and entrepreneurs; suggesting lack of gender parity in MFIs financing SMEs in Kisumu County.
Table 3. Respondents’ demographic attributes.
Attribute | Managers | Departmental heads | Entrepreneurs | Total |
Freq | Pct | Freq | Pct | Freq | Pct | Freq | Pct |
Gender | | | | | | | | |
Male | 23 | 63.9 | 78 | 54.2 | 110 | 63.2 | 211 | 59.6 |
Female | 13 | 36.1 | 66 | 45.8 | 64 | 36.8 | 143 | 40.4 |
Total | 36 | 100.0 | 144 | 100.0 | 174 | 100.0 | 354 | 100.0 |
Age | | | | | | | | |
<25 years | 0 | 0.0 | 7 | 4.9 | 7 | 4.0 | 14 | 4.0 |
26 - 35 years | 4 | 11.1 | 46 | 31.9 | 113 | 64.9 | 163 | 46.0 |
36 - 45 years | 14 | 38.9 | 83 | 57.6 | 54 | 31.0 | 151 | 42.7 |
46 - 55 years | 16 | 44.4 | 8 | 5.6 | 0 | 0.0 | 24 | 6.8 |
>55 years | 2 | 5.6 | 0 | 0.0 | 0 | 0.0 | 2 | 0.6 |
Total | 36 | 100.0 | 144 | 100.0 | 174 | 100.0 | 354 | 100.0 |
Education level | | | | | | | | |
High school | 0 | 0.0 | 10 | 6.9 | 4 | 2.3 | 14 | 4.0 |
Diploma | 3 | 8.3 | 19 | 13.2 | 30 | 17.2 | 52 | 14.7 |
Bachelor’s degree | 18 | 50.0 | 99 | 68.8 | 120 | 69.0 | 237 | 66.9 |
Masters | 15 | 41.7 | 16 | 11.1 | 20 | 11.5 | 51 | 14.4 |
Total | 36 | 100.0 | 144 | 100.0 | 174 | 100.0 | 354 | 100.0 |
Respondents were aged between 19 and 64, with 163 (46.0%) being in the 26-35 age bracket, 151 (42.7%) were in the 36-45 years age group, while 24 (6.8%) indicated 46-55 years. Cumulatively, up to 314 (88.7%) respondents were in the productive age bracket of 26 to 45 years. The distribution was homogenous across the respondent categories, except for the category of managers, where up to one-half (50%) were aged 46 years and above. The analysis showed that the distribution of age and category of respondents was significant at 90% confidence level; suggesting that respondents’ age distribution varied significantly across the three categories of respondents.
Regarding education level, 237 (66.9%) reported having bachelor’s degree education, followed by 52 (14.7%) respondents with diploma and 51 (14.4%) holders of master’s degrees. Whereas 41.7% of the managers had master’s education, the proportion of bachelor’s degree holders was fairly homogenous among departmental heads and entrepreneurs. Those with high school education were 14 (4.0%). The analysis revealed a significant association between education level and category of respondents.
4.2. Performance of MFIs Financing SMEs
Performance of MFIs financing SMEs in Kisumu County was measured by asking respondents to indicate views on selected performance indicators, on a five-point Likert scale. The results presented in
Table 4 show that out of 354 respondents, 218 (61.6%) strongly agreed with the statement suggesting that
most customers were always satisfied with the organization’s services, while 98 (27.7%) agreed. However, 17 (4.7%) respondents disagreed with the statement, while 6 (1.6%) indicated strong disagreement. Cumulatively, about 89% of respondents were positive about borrowers’ satisfaction with MFI financial services. A high level of satisfaction with MFI financial services suggests a high level of high performance. Still on the same, some management respondents affirmed the happiness of their customers with services provided by MFIs. In this regard, the management respondents indicated that services provided by their organizations were tailored to meet borrowers’ financial needs, which in turn, facilitated business growth.
Table 4. Performance of MFIs financing SMEs.
Performance indicator | Strongly agree | Agree | Neutral | Disagree | Strongly disagree | Total |
Customers are always satisfied with the organization’s services. | 218 (61.6%) | 98 (27.7%) | 16 (4.4%) | 17 (4.7%) | 6 (1.6%) | 354 (100.0%) |
Organization’s loan portfolio has been growing every year. | 106 (29.9%) | 135 (38.1%) | 33 (9.4%) | 46 (12.9%) | 34 (9.7%) | 354 (100.0%) |
M&E on loans issued is a regular practice in the organization. | 88 (24.8%) | 146 (41.2%) | 45 (12.6%) | 34 (9.7%) | 41 (11.6%) | 354 (100.0%) |
Organization’s loan recovery rate is above average. | 130 (36.8%) | 115 (32.4%) | 28 (7.9%) | 40 (11.3%) | 41 (11.6%) | 354 (100.0%) |
Organization shares financial statements with stakeholders routinely. | 67 (18.9%) | 135 (38.1%) | 57 (16.0%) | 49 (13.8%) | 47 (13.2%) | 354 (100.0%) |
The results in
Table 4 indicate that of the 354 respondents, 135 (38.1%) agreed with the statement suggesting that
organizational loan portfolio had been growing every year, while 106 (29.9%) agreed strongly with the assertion. On the other side of the scale, 46 (12.9%) respondents disagreed with the statement, while 34 (9.7%) agreed strongly. Cumulatively, 241 (68.0%) were positive about the growth of organizational loan portfolio, while 80 (22.6%) indicated negative opinions about the same. Thus, for more than two-thirds of respondents, there was growth in loan portfolio, which signified improvement in performance.
A significant proportion of respondents, 146 (41.2%), agreed with the statement claiming that M&E on loans issued to entrepreneurs was a regular practice in the organizations, while 88 (24.8%) agreed strongly with the assertion. Despite this, 41 (11.6%) disagreed strongly with the statement, while 34 (9.7%) indicated disagreement. Collectively, 234 (66.0%) respondents affirmed that M&E on loans was a regular practice. The consistency of M&E practice on issued loans was considered an important practice for organizational performance. Given that more than two-thirds of respondents were positive about the consistency of M&E practice, suggests that more than a half of MFIs were poised for high performance. MFI managers further acknowledged that M&E was a normal practice of following up loaned entrepreneurs to find out how credit facilities were used, provide guidance and establish their contribution to the growth of SMEs, which in turn, contributes to performance of MFIs financing SMEs. Some respondents noted that consistent M&E of loans was essential for enhancing good financial management among the entrepreneurs.
The results show that of the 354 respondents, 130 (36.8%) strongly agreed that organization’s loan recovery rate was above average, while 115 (32.4%) agreed with the assertion. Contrastingly, 41 (11.6%) disagreed strongly with the statement, while 40 (11.3%) disagreed with the statement. Collectively, 245 (69.2%) respondents affirmed that loan repayment rate was above average; suggesting that most respondents were positive about performance of MFIs financing SMEs, the managers attributed this to effective loan recovery measures and growth of SME businesses.
Further analysis revealed that of the 354 respondents, 135 (38.1%) agreed that MFIs shared financial statements with stakeholders routinely, while 67 (18.9%) indicated strong agreement. However, 49 (13.8%) respondents disagreed with the statement, while 47 (13.2%) indicated strong disagreement. Collectively, 202 (57.0%) respondents expressed positive opinions about consistency with which MFIs shared financial statements with stakeholders. Thus, more than one-half of the respondents affirmed that financial statements were routinely shared with stakeholders. Transparency with financial statements was considered an important indicator of performance; thus, organizations sharing such information with stakeholders consistently were likely to be high performers.
Based on the stated indicators of MFI performance, respondents were requested to rate performance of MFIs on a scale of 1 to 10, where 1 and 2 signified very poor performance, 3 and 4 indicated poor performance, 5 and 6 signaled average performance, 7 and 8 meant good performance, while 9 and 10 signaled very good performance. Descriptive analysis generated the results presented in
Table 5.
Table 5. Descriptive analysis of MFI performance in Kisumu County, Kenya.
Respondents | N | Mean | Std. Dev. | Std. Error | 95% Confidence Interval for Mean | Min | Max |
Lower Bound | Upper Bound |
Managers | 36 | 7.3 | 1.242 | 0.207 | 6.9 | 7.8 | 5 | 10 |
Departmental heads | 144 | 6.8 | 1.516 | 0.126 | 6.6 | 7.1 | 3 | 10 |
Entrepreneurs | 174 | 6.5 | 1.608 | 0.122 | 6.3 | 6.8 | 3 | 10 |
Total | 354 | 6.7 | 1.552 | 0.083 | 6.6 | 6.9 | 3 | 10 |
ANOVA
| Sum of Squares | df | Mean Square | F | Sig. |
Between Groups | 20.572 | 2 | 10.286 | 4.351 | 0.014** |
Within Groups | 829.849 | 351 | 2.364 | | |
Total | 850.421 | 353 | | | |
*** Significant at ρ<0.05
Table 5 shows that the analysis obtained a mean score of 6.7 (95% CI, 6.6-6.9), which according to the rating scales, suggests an average performance. More specifically, perception about MFI performance was highest among the managers with a mean score of 7.3 (95% CI, 6.9-7.8), and lowest among entrepreneurs, with a mean score of 6.5 (95% CI, 6.3-6.8).
4.3. Correlation Analysis Between M&E Communication and Performance of MFIs
The study focused on determining correlation between M&E communication and performance of MFIs financing SMEs, using Spearman’s rank correlation. The respondents indicated opinions on various aspects of M&E communication, on a 5-point Likert scale. The perceptions were aggregated by summing the scores, and recoding the same as 1 for the score range of 1-5, 2 for a score of 6-10, 3 for 11-15, 4 for 16-20, and 5 for 21-25. Aggregated perceptions were correlated with performance of MFIs financing SMEs, using Spearman’s Rank Correlation Coefficient (r
s). This was done for each aspect of M&E communication, as indicated in
Table 6.
Table 6. Correlation between M&E communication and performance of MFIs.
| | Performance of MFIs financing SMEs |
M&E results are communicated using appropriate methods | Correlation coefficient (rs) | 0.578*** |
ρ-value | 0.000 |
N | 354 |
Communication of M&E results is timely | Correlation coefficient (rs) | 0.511*** |
ρ-value | 0.000 |
N | 354 |
M&E communication is consistent | Correlation coefficient (rs) | 0.504*** |
ρ-value | 0.000 |
N | 354 |
M&E results are utilized in decision-making processes | Correlation coefficient (rs) | 0.475*** |
ρ-value | 0.001 |
N | 354 |
M&E results are communicated using simple language for learning | Correlation coefficient (rs) | 0.454*** |
ρ-value | 0.002 |
N | 354 |
*** Significant at ρ<0.01
The results show a positive correlation between appropriateness of the methods used to communicate M&E and performance of MFIs, with a moderate strength (r
s = 0.578 & Sig. [ρ-value] = 0.000); which was significant at 99% confidence level.
Table 6 further shows a positive correlation between the timeliness of M&E communication and performance of MFIs, of moderate strength (r
s = 0.511 & ρ-value = 0.000), which is significant at 99% confidence level. The results further show a positive correlation between consistency of M&E communication and improvement of MFI performance of MFIs (r
s = 0.504 & ρ-value = 0.000), which is also significant at 99% confidence level. Performance of MFIs funding also correlated positively with utilization of M&E results in decision-making processes (r
s = 0.475 & ρ-value = 0.001); as well as simplicity of the language in which M&E results are communicated (r
s = 0.454 & ρ-value = 0.002). Overall, the results show that a unit improvement of M&E communication positively and significantly correlated with performance of MFIs financing SMEs in Kisumu County; thus, improving M&E communication practices is likely to influence performance of the said organizations.
4.4. Regression Analysis of M&E Communication Practices and Performance of MFIs
A further test of significance was performed using multiple linear regression analysis. Thus, M&E communication practices were regressed against performance of MFIs. The regression analysis generated two models: Model 1 incorporated M&E communication practices, as independent variables against performance of MFIs financing SMEs; while Model 2 regressed M&E communication practices and Organizational culture against performance of MFIs. Normality, linearity and collinearity tests were performed to validate the regression models. For example, collinearity tests were interpreted from the Variable Inflation Factor (VIF). The analysis generated VIF values ranging between 1 and 1.419, which suggested lack of, to tolerable levels of collinearity between the independent variables.
Table 7 summarizes the regression analysis results.
Table 7. Summary of regression analysis.
Model | Unstandardized Coefficients | Standardized Coefficients | t | ρ-value |
B | Std. Error | Beta |
1 | (Constant) | 1.930 | 0.102 | | 14.658 | 0.000*** |
Methods used in M&E communication | 0.425 | 0.034 | 0.574 | 12.341 | 0.000*** |
Language used in M&E communication | 0.416 | 0.096 | 0.562 | 12.085 | 0.000*** |
Consistency of M&E communication | 0.238 | 0.180 | 0.322 | 6.914 | 0.033** |
Timeliness of M&E communication | 0.301 | 0.131 | 0.407 | 8.744 | 0.010** |
Use of M&E results in decision-making | 0.385 | 0.112 | 0.519 | 11.184 | 0.001*** |
M&E communication practices | 0.353 | 0.111 | 0.477 | 10.254 | 0.009*** |
2 | (Constant) | 2.028 | 0.088 | | 15.058 | 0.000*** |
Methods used in M&E communication | 0.525 | 0.021 | 0.591 | 13.150 | 0.000*** |
Language used in M&E communication | 0.515 | 0.052 | 0.580 | 13.045 | 0.000*** |
Consistency of M&E communication | 0.336 | 0.165 | 0.339 | 8.101 | 0.022** |
Timeliness of M&E communication | 0.479 | 0.118 | 0.488 | 9.209 | 0.004*** |
Use of M&E results in decision-making | 0.585 | 0.096 | 0.608 | 14.506 | 0.000*** |
M&E communication practices | 0.488 | 0.090 | 0.521 | 11.602 | 0.005*** |
| Organizational culture | 0.237 | 0.118 | 0.282 | 5.238 | 0.039** |
Dependent Variable: Performance of MFIs financing SMEs |
** & *** shows significance at the ρ<0.05 & ρ<0.01, respectively.
The results generated by Model 1 show that appropriateness of methods used to communicate M&E results had the strongest positive effect on performance of MFIs financing SMEs in Kenya (Beta = 0.574 & ρ-value = 0.000); which was significant at 99% confidence level. This suggests that a unit improvement in the methods used in M&E communication accounted for up to 0.574 of variance in performance of MFIs. Simplicity of the language used to communicate M&E results also had a positive effect on performance of MFIs. Model 1 shows that the analysis obtained a Beta coefficient of 0.562 and ρ-value = 0.000, which suggest a positive and significant influence of average strength. Thus, simplicity of the language used to communicate M&E results accounted for 0.580 of variance in performance of MFIs financing SMEs. This suggests that using simple language to communicate M&E results was likely to improve performance of MFIs financing SMEs.
Utilization of M&E results in decision-making had positive effect on performance of MFIs (Beta = 0.519 & ρ-value = 0.001), which was significant at 99% confidence level. The result suggests that utilization of M&E results in decision-making accounted for up to 0.519 of variance in performance of MFIs. The results further show that timeliness of M&E communication of results also had a positive and significant effect on performance of MFIs (Beta = 0.407 & ρ-value = 0.010). This suggests that improving the timeliness of M&E communication of results accounted for 0.407 of variance in performance of MFIs. Consistency of M&E communication also had a positive effect on performance of MFIs, as indicated by the Beta coefficient of 0.322 and ρ-value = 0.033. Thus, ensuring consistency of M&E communication was essential for improving performance of MFIs up to 0.322.
On aggregate, M&E communication practices had an average positive and significant effect on performance of MFIs (Beta = 0.477, t = 10.254 & ρ-value = 0.009). This suggests that for every unit standard deviation from the mean for M&E communication practices, performance of MFIs increased by up to 0.477; and the variance was significant at 99% confidence level. This led to rejection of the first null hypothesis stating that M&E communication has no significant influence on performance of MFIs in Kenya.
In Model 2 organizational culture was incorporated in the regression model. This action caused various changes in the influence of each aspect of M&E practices on performance of MFIs. More particularly, the Beta value for appropriateness of methods used to communicate M&E results improved by 3.0% from 0.574 in Model 1 to 0.519 in Model 2. Addition of organizational culture in the equation elevated the Beta value for language used to communicate M&E results by 3.2% from 0.562 in Model 1 to 0.580 in Model 2. The Beta value for utilization of M&E results in decision-making also increased by 17.1% from 0.519 in Model 1 to 0.608 in Model 2. In the case of timeliness of M&E communication, the Beta value increased by 19.9% from 0.407 in Model 1 to 0.488 in Model 2; while the Beta value for consistency of M&E communication increased by 5.3% from 0.322 in Model 1 to 0.339 in the second Model.
The results show that addition of the moderating variable in the regression equation had the highest influence on timeliness of M&E communication (19.9%), followed by utilization of M&E results in decision-making (17.1%), consistency of M&E communication (5.3%), language used to communicate M&E results (3.2%) and appropriateness of methods used to communicate M&E results (3.0%). Besides, all the changes influenced by organizational culture were statistically significant at 99% confidence level, except for consistency of M&E communication, for which the change was significant at 95% confidence level.
On aggregate, the addition of organizational culture in the regression equation strengthened the influence of M&E communication practices on performance of MFIs by 9.3% from 0.477 in Model 1 to 0.521 in Model 2. The analysis obtained a ρ-value of 0.005, suggesting up to 99% chance that the influence of organizational culture on the relationship between M&E communication practices and performance of MFIs was significant. This led to rejection of the second null hypothesis stating that organizational culture has no significant influence on the relationship between M&E communication and performance of MFIs in Kenya. This suggests that statistical relations between M&E communication practices and performance of MFIs became stronger and more robust, with the addition of organizational culture in the regression model.
The analysis further obtained an adjusted coefficient of determination (R
2) of 0.477 for Model 1, which suggests that M&E communication practices, collectively, accounted for 47.7% of variance in performance of MFIs financing SMEs funding in Kisumu County; which was significant at 99% confidence level (F statistic = 146.046 & ρ-value = 0.000), as indicated in
Table 8.
Table 8. Goodness-of-fit of the Regression Model.
Model | R | R Square | Adjusted R Square | Std. Error of the Estimate |
1 | 0.562 | 0.479 | 0.477 | 0.509 |
2 | 0.614 | 0.524 | 0.521 | 0.556 |
ANOVA
Model | | Sum of Squares | df | Mean Square | F | Sig. |
1 | Regression | 37.832 | 1 | 37.83 | 146.046 | 0.000*** |
| Residual | 81.857 | 316 | 0.259 | |
| Total | 119.688 | 317 | | |
2 | Regression | 41.350 | 1 | 41.348 | 159.628 | 0.000*** |
| Residual | 89.470 | 316 | 0.283 | |
| Total | 130.819 | 317 | | |
The second Model with M&E practices and organizational culture, indicates that the analysis obtained an Adjusted R Square of 0.521. This implies that Model 2 accounted for up to 52.1% of variance in performance of MFIs and the effect was significant at 99% confidence level (F statistic = 159.628 & ρ-value = 0.000). Thus, addition of the moderating variable in the regression model enhanced the predictive power of the regression model by 9.2%. This underscores the importance of organizational culture in improving the relationship between M&E communication practices and performance of MFIs financing SMEs.
5. Discussions
The study sought to determine the influence of M&E communication practices on performance of MFIs financing SMEs in Kenya; as well as determine the moderating influence of organizational culture on the relationship between M&E communication and performance of MFIs. The analysis revealed the importance of M&E in relation to performance of the MFIs. On aggregate, M&E communication had an average positive and significant effect on performance of MFIs (Beta = 0.477, t = 10.254 & ρ-value = 0.009). This led to rejection of the first null hypothesis for being inconsistent with empirical findings
. The findings underscore the critical role of M&E communication as a key driver of performance among MFIs. The observed positive and significant relationship suggests that effective communication of M&E findings enhances performance by improving the adaptive capacity, accountability, and strategic responsiveness of MFIs. This relationship is attributable to several underlying mechanisms. Firstly, M&E communication strengthens feedback loops, enabling MFIs to identify performance gaps, track progress toward targets and goals, and make adjustments informed by evidence. When findings are systematically shared across departments and hierarchical levels, they trigger organizational learning processes such as reflection, knowledge sharing, and corrective action, which are according to Naveed et al.
| [38] | Naveed, R. T., Alhaidan, H., & Abbas, J. (2022). Do organizations really learn from experience? The moderating role of organizational culture in the relationship between learning and performance. Journal of Open Innovation: Technology, Market, and Complexity, 8(1), 18.
https://doi.org/10.3390/joitmc8010018 |
[38]
are central to continuous improvement. This aligns with the Systems Theory, which posits that open systems thrive on feedback to adapt and maintain equilibrium in dynamic environments
.
Secondly, effective M&E communication fosters a culture of transparency and participation, which in turn, enhances staff engagement and ownership of institutional objectives. Open flow of information within institutions encourages and strengthens trust, collaboration and collective problem-solving and innovation. This is consistent with the OLT, where learning-oriented cultures amplify the utilization of M&E insights in strategic and operational decisions. Lastly, from a RBV perspective, the ability to communicate and act on M&E information constitutes an intangible organizational capability, that is not only valuable and rare, but also hard to replicate, translating to superior performance
. Therefore, the significant empirical effect observed is not merely statistical, but a reflection of a deep-seated strategic advantage that is rooted in effective information management, adaptive learning, and an enabling organizational culture.
Similar findings were reported by Okafor
| [26] | Okafor, A. E. (2021). Influence of monitoring and evaluation system on the performance of projects. Journal of Social Science and Humanities Research, 6(8), 34-49.
https://doi.org/10.53555/sshr.v6i8.4535 |
[26]
, who established a significant positive correlation between M&E and project performance, suggesting that M&E communication was likely to have a positive influence on project performance. However, the two studies differ in terms of the methodological rigor. Among the M&E practices, this study established that appropriateness of methods used to communicate M&E results had the strongest positive effect on performance of MFIs, followed by simplicity of the language used, utilization of M&E results in decision-making, as well as the timeliness and consistency of M&E communication.
Effective M&E communication in MFIs depends largely on the methods, language, and timeliness of information sharing. MFIs use diverse digital and non-digital channels, such as emails, memos, social media, community meetings, charts, and virtual conferences, to convey results to stakeholders. The choice of method should align with the stakeholders’ education level, needs, and context. Therefore, understanding stakeholder characteristics is critical for tailoring M&E communication strategies that enhance engagement and learning. Similarly, the language used shapes comprehension and feedback: simple, clear language supported by visual aids fosters better understanding and participation, while overly technical communication can weaken message uptake.
The utilization and timeliness of M&E information are equally vital in determining MFI performance. When results are systematically used in decision-making, they help managers to identify emerging issues, design corrective measures, optimize resource use, and demonstrate accountability. Evidence-based decision-making also fosters organizational learning and innovation, contributing to more effective financial service delivery. However, challenges such as limited resources, resistance to change, and unsupportive organizational culture may hinder the effective use of M&E findings. Moreover, timely dissemination of results ensures that information remains relevant in a fast-changing business environment, enabling stakeholders to act promptly. In contrast, delayed communication diminishes the usefulness of M&E outputs and constrains adaptive management and performance improvement.
Furthermore, the organizational culture significantly enhanced the explanatory power of the regression model by amplifying the influence of M&E communication on the performance of MFIs. This moderating effect suggests that the relationship between M&E communication and performance is not merely direct, but also shaped by the underlying organizational cultural context within which information is shared and acted upon. When organizational culture promotes openness, collaboration, and accountability, M&E communication becomes more acceptable, internalized, and transformed into actionable insights. Effective organizational cultures encourage dialogue, continuous learning, and collective problem-solving - mechanisms that strengthen feedback loops, which are essential for improved performance outcomes.
Conceptually, the organizational culture acts as a social and cognitive filter that determines how M&E information is received, perceived and utilized. A supportive culture enhances trust and information flow across departments, ensuring that employees receive and respond constructively to M&E findings. This process is likely to nurture a sense of shared ownership of institutional goals, while fostering intrinsic motivation among staff, leading to higher engagement, innovation, and productivity. Conversely, a rigid or hierarchical culture is likely to suppress communication, discourage feedback, and limit the use of M&E insights in decision-making. Therefore, the more positive the organizational culture, the better the odds of M&E communication translating into operational efficiency and institutional performance. In line with this perspective, previous studies by Morgan
and Mafrudoh
affirm that strong organizational cultures foster higher levels of employee engagement compared to weak ones. Organizations with robust cultures tend to exhibit greater staff motivation and job satisfaction, alongside reduced absenteeism and lower employee turnover rates.